
Clinical context
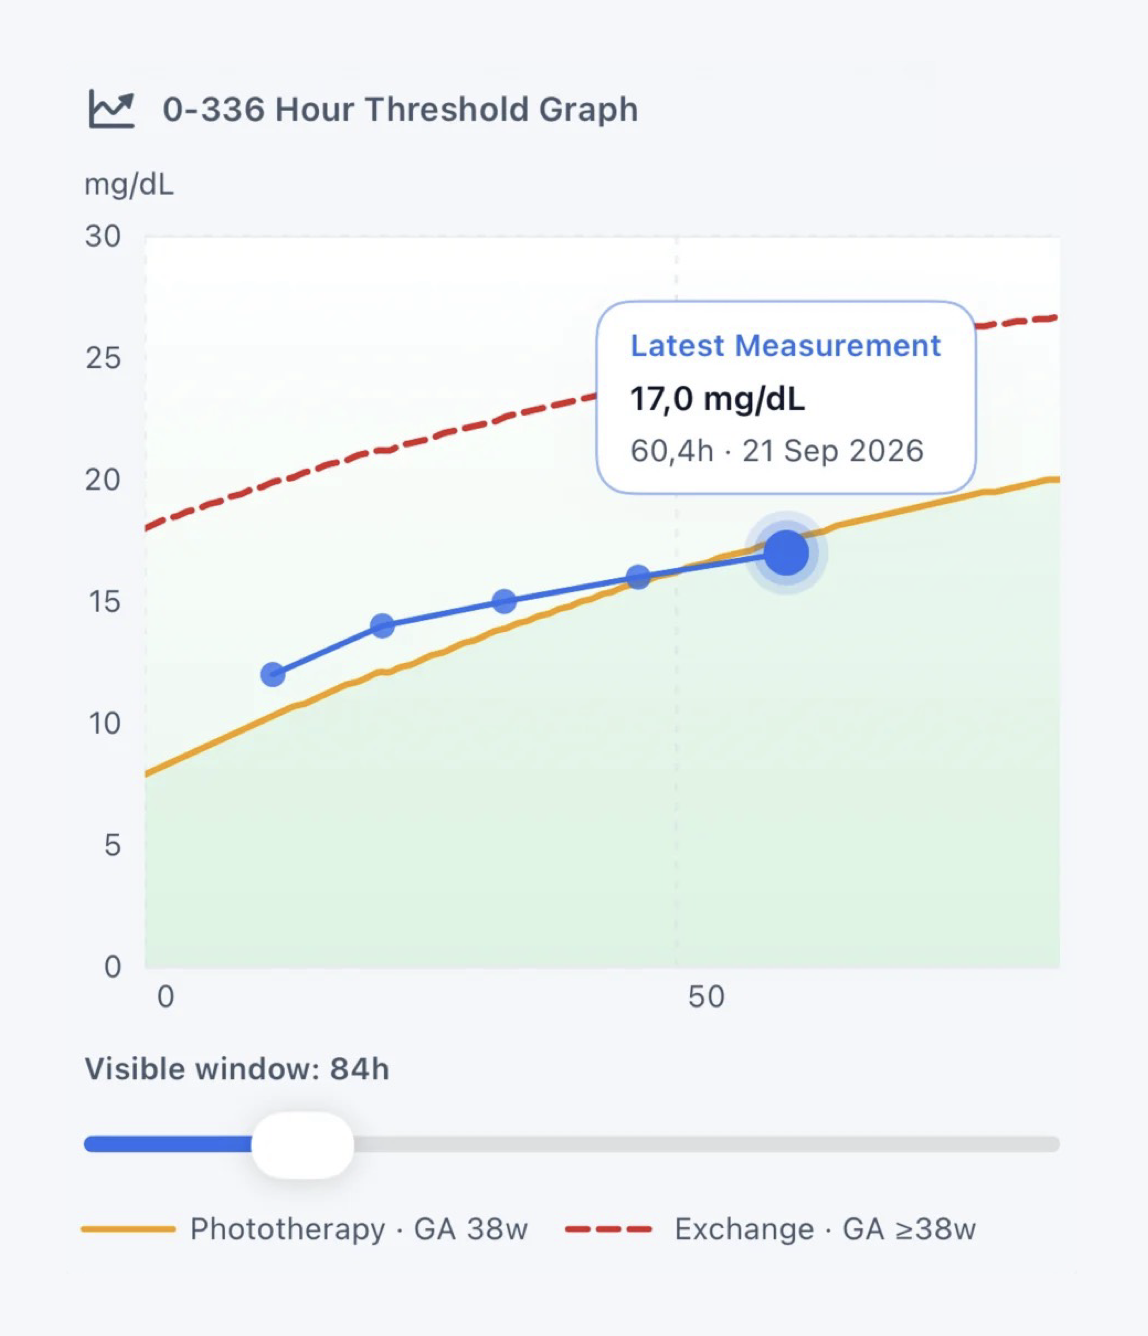
The AAP guideline addresses prevention, risk assessment, monitoring, and management of hyperbilirubinemia in newborn infants born at 35 weeks’ gestation or later. Its phototherapy and exchange transfusion graphs plot total serum bilirubin against postnatal age in hours.
Treatment thresholds vary with gestational age and with the presence of hyperbilirubinemia neurotoxicity risk factors. The guideline provides separate phototherapy figures for infants with and without additional neurotoxicity risk factors.
Confirm gestational age, the infant’s exact postnatal age, applicable neurotoxicity risk factors, measurement method, previous treatment, and the broader clinical picture. Consult the official guideline for full definitions and recommendations.
Inputs that determine the threshold view
| Input | Why it matters | Practical check |
|---|---|---|
| Postnatal age | Thresholds are hour-specific rather than organized only by postnatal day. | Use the measurement time relative to the recorded birth time. |
| Gestational age | The AAP charts contain gestational-age-specific curves from 35 weeks onward. | Confirm completed weeks at birth. |
| Neurotoxicity risk | Additional risk factors determine which phototherapy and exchange-threshold figure is applicable. | Use the guideline’s definitions; gestational age is handled explicitly within the framework. |
| Bilirubin measurement | Treatment decisions are based on total serum bilirubin; the guideline also describes when transcutaneous results should be confirmed. | Verify units and measurement method. |
How to interpret the graph
- Identify the infant’s postnatal age at the time of measurement.
- Select the correct gestational-age curve and the appropriate risk-factor figure.
- Plot the bilirubin measurement using consistent units.
- Assess its position relative to the phototherapy threshold, escalation-of-care threshold, and exchange transfusion threshold described by the guideline.
- Use the distance from the phototherapy threshold, clinical circumstances, and ability to arrange follow-up when planning reassessment.
Rate of rise in the AAP guideline
The AAP describes a bilirubin rate of increase of at least 0.3 mg/dL per hour during the first 24 hours, or at least 0.2 mg/dL per hour thereafter, as exceptional and suggestive of hemolysis. Rate of rise is therefore a signal to investigate in context—not a substitute for the treatment-threshold graphs.
The 2022 guideline changed post-discharge follow-up planning from the earlier risk-zone approach to the difference between the bilirubin concentration and the hour-specific phototherapy threshold, together with other clinical considerations.
NeoBili Pro example
View AAP thresholds on iPhone
Enter age, gestation, risk context, and bilirubin to visualize the selected AAP 2022 threshold view and serial measurements.
View NeoBili Pro on the App Store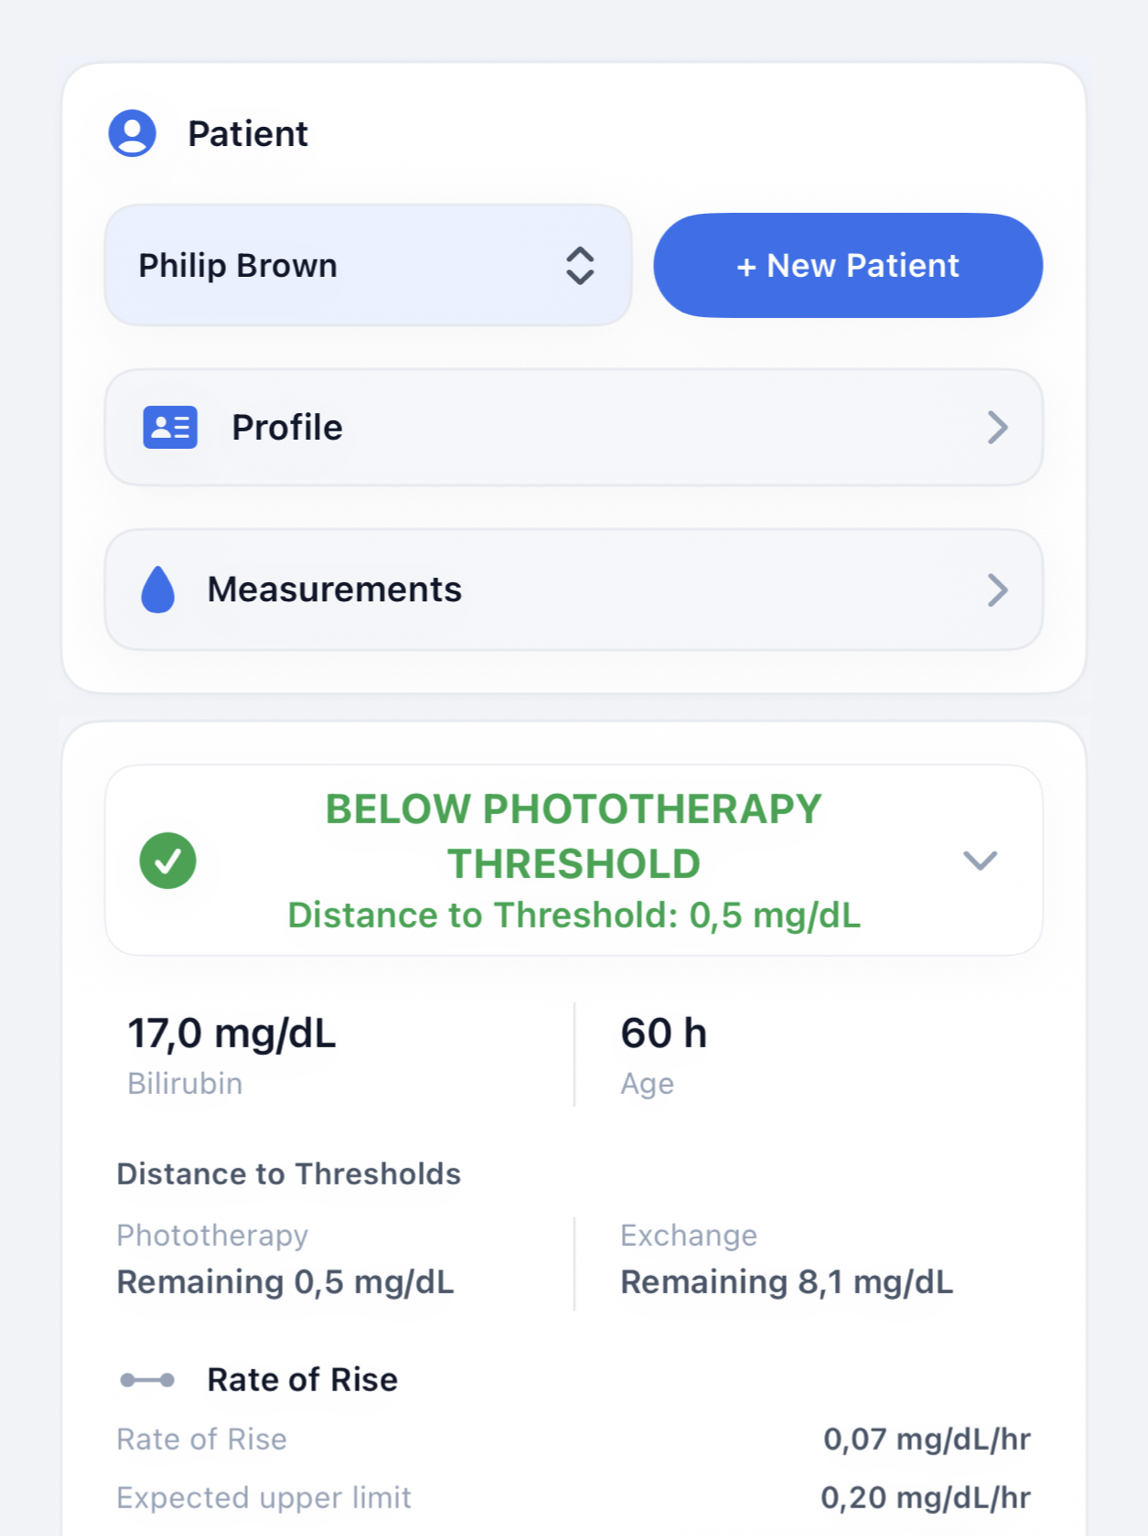
Official references
- AAP Clinical Practice Guideline Revision: Management of Hyperbilirubinemia ↗Pediatrics. 2022;150(3):e2022058859.
- AAP implementation FAQ for the 2022 guideline ↗Clarifies selection of the risk-factor figures and other implementation questions.