
Definition and calculation
Calculate rate of rise from two bilirubin measurements obtained at different times. Use the same analyte and units for both values, and calculate the elapsed interval from the actual collection times.
For example, an increase from 12.0 to 15.0 mg/dL over 12 hours is a rise of 3.0 mg/dL divided by 12 hours, or 0.25 mg/dL per hour. This calculation alone does not determine treatment.
What to verify before calculating
| Check | Reason |
|---|---|
| Measurement timestamps | Rounded ages or dates can materially change a per-hour rate over short intervals. |
| Consistent units | Do not subtract a value in mg/dL from one in micromol/L. |
| Measurement method | Record whether results are total serum bilirubin or transcutaneous bilirubin and follow the selected guideline for confirmatory testing. |
| Treatment timing | Phototherapy or other interventions between measurements change the context of the observed trajectory. |
| Patient context | Gestational age, age in hours, risk factors, feeding, hemolysis evaluation, and clinical status remain relevant. |
AAP 2022 context
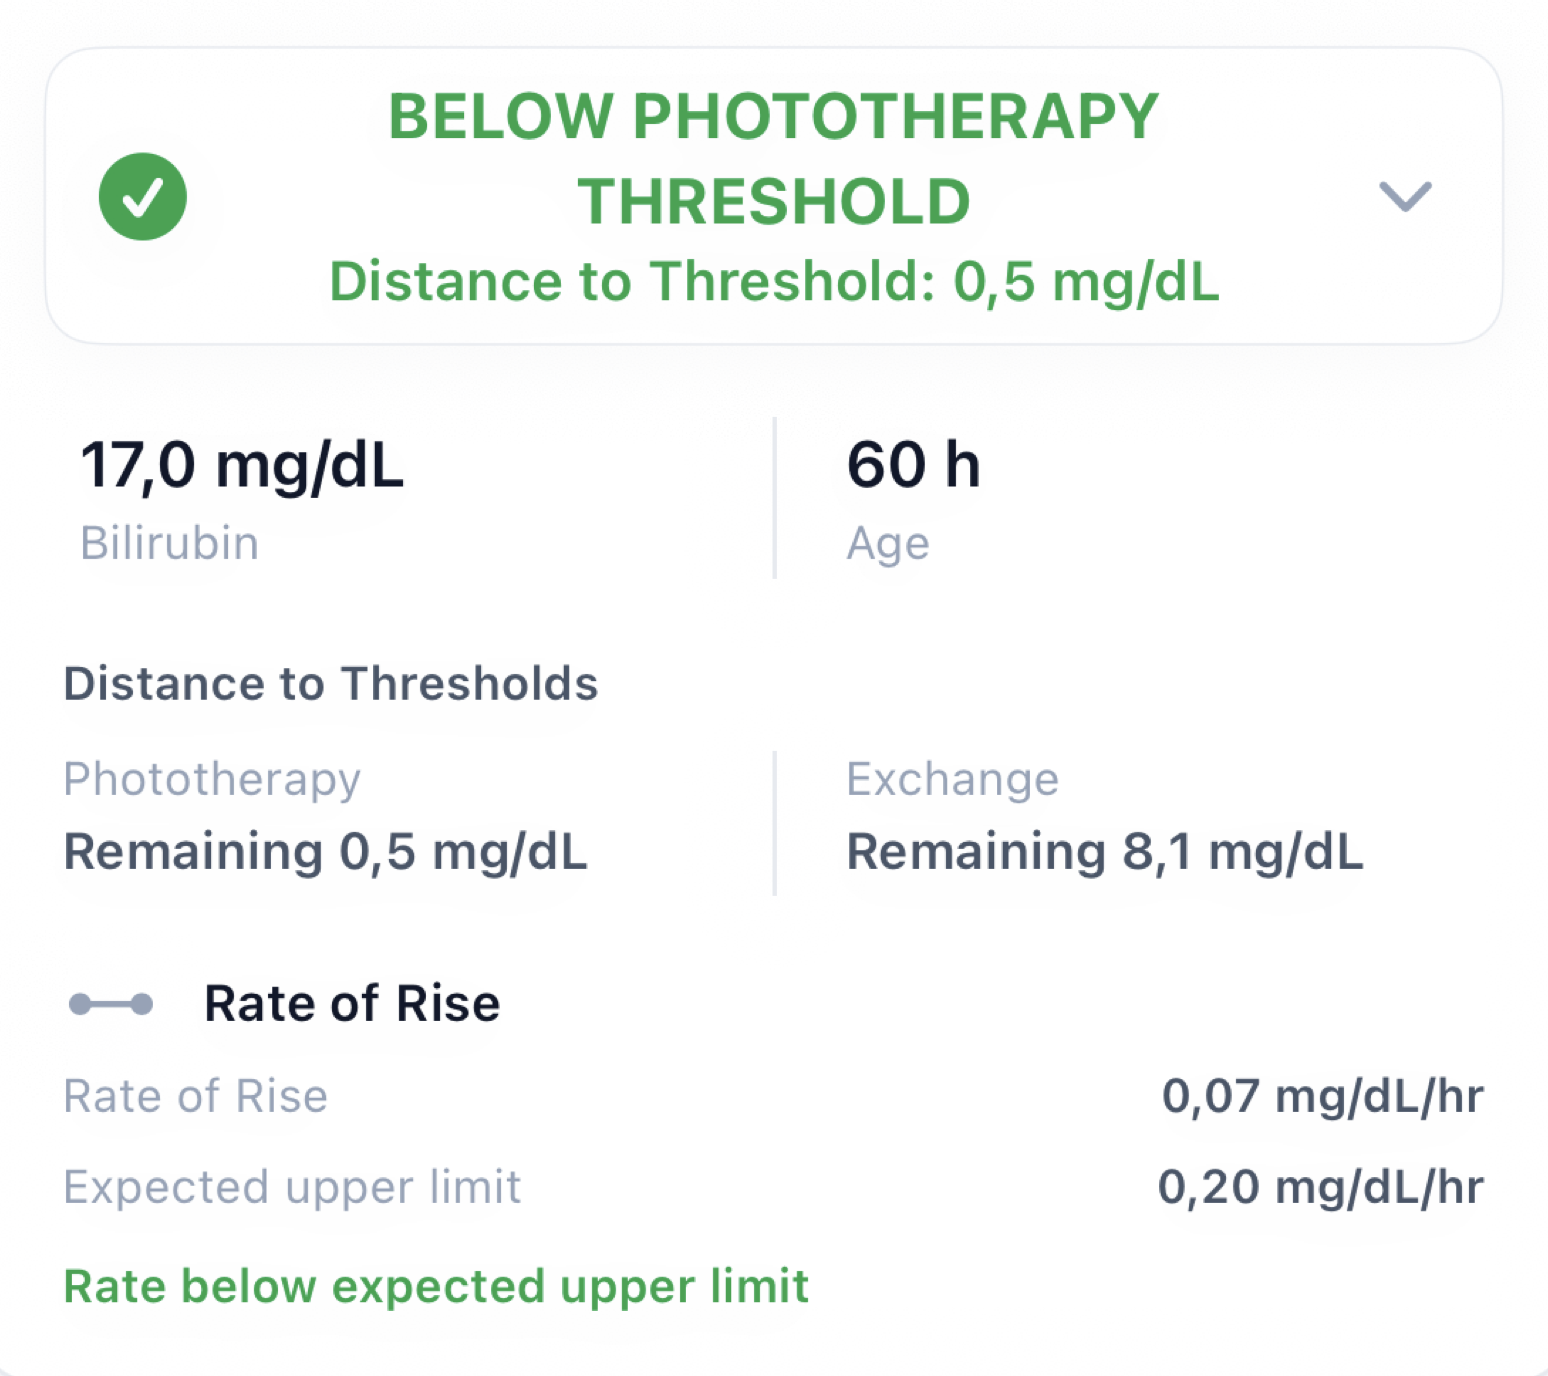
The AAP guideline describes a rise of at least 0.3 mg/dL per hour during the first 24 hours, or at least 0.2 mg/dL per hour thereafter, as exceptional and suggestive of hemolysis. The guideline includes rapid increase among risk factors for developing significant hyperbilirubinemia.
Use rate of rise to support assessment and further evaluation. Phototherapy and exchange decisions still depend on the applicable hour-specific treatment thresholds and clinical circumstances.
NICE CG98 context
NICE uses its own framework and units. CG98 describes bilirubin rising more than 8.5 micromol/L per hour as rapidly rising in recommendations related to intensified phototherapy and increased kernicterus risk.
The AAP and NICE values should not be detached from their surrounding recommendations or treated as interchangeable cutoffs. Record the selected guideline whenever documenting the rate.
Clinical interpretation
- Confirm that the interval is long enough and the timestamps are reliable.
- Review the plotted trajectory, not only the last pair of results.
- Consider how close the current value is to the relevant phototherapy threshold.
- Evaluate possible hemolysis and other causes when the trajectory is unexpectedly rapid.
- Follow the official guideline and local protocol for testing, monitoring, treatment, and escalation.
NeoBili Pro example
Calculate and visualize bilirubin trends on iPhone
Add sequential measurements to calculate rate of rise and see the values against the selected treatment thresholds.
View NeoBili Pro on the App Store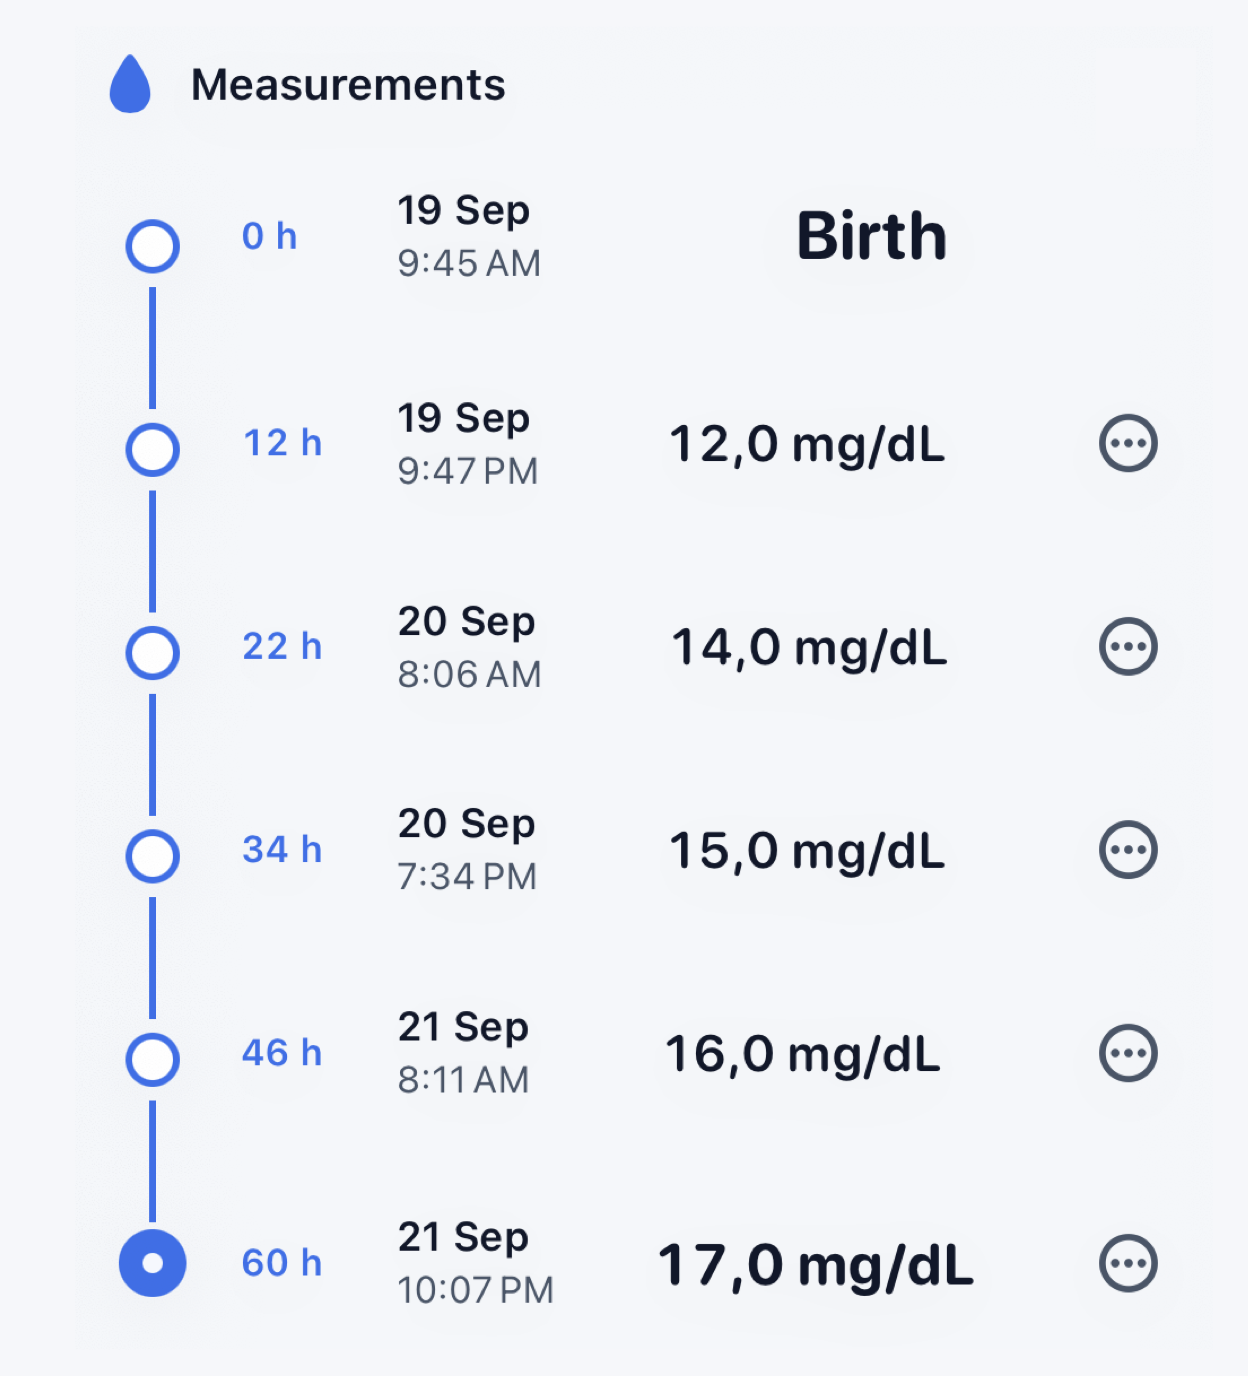
Official references
- AAP 2022 Clinical Practice Guideline ↗See risk factors and the discussion of rapid rate of increase.
- NICE CG98 recommendations ↗See phototherapy and kernicterus-risk recommendations concerning rapid rise.